Financial Management Platform
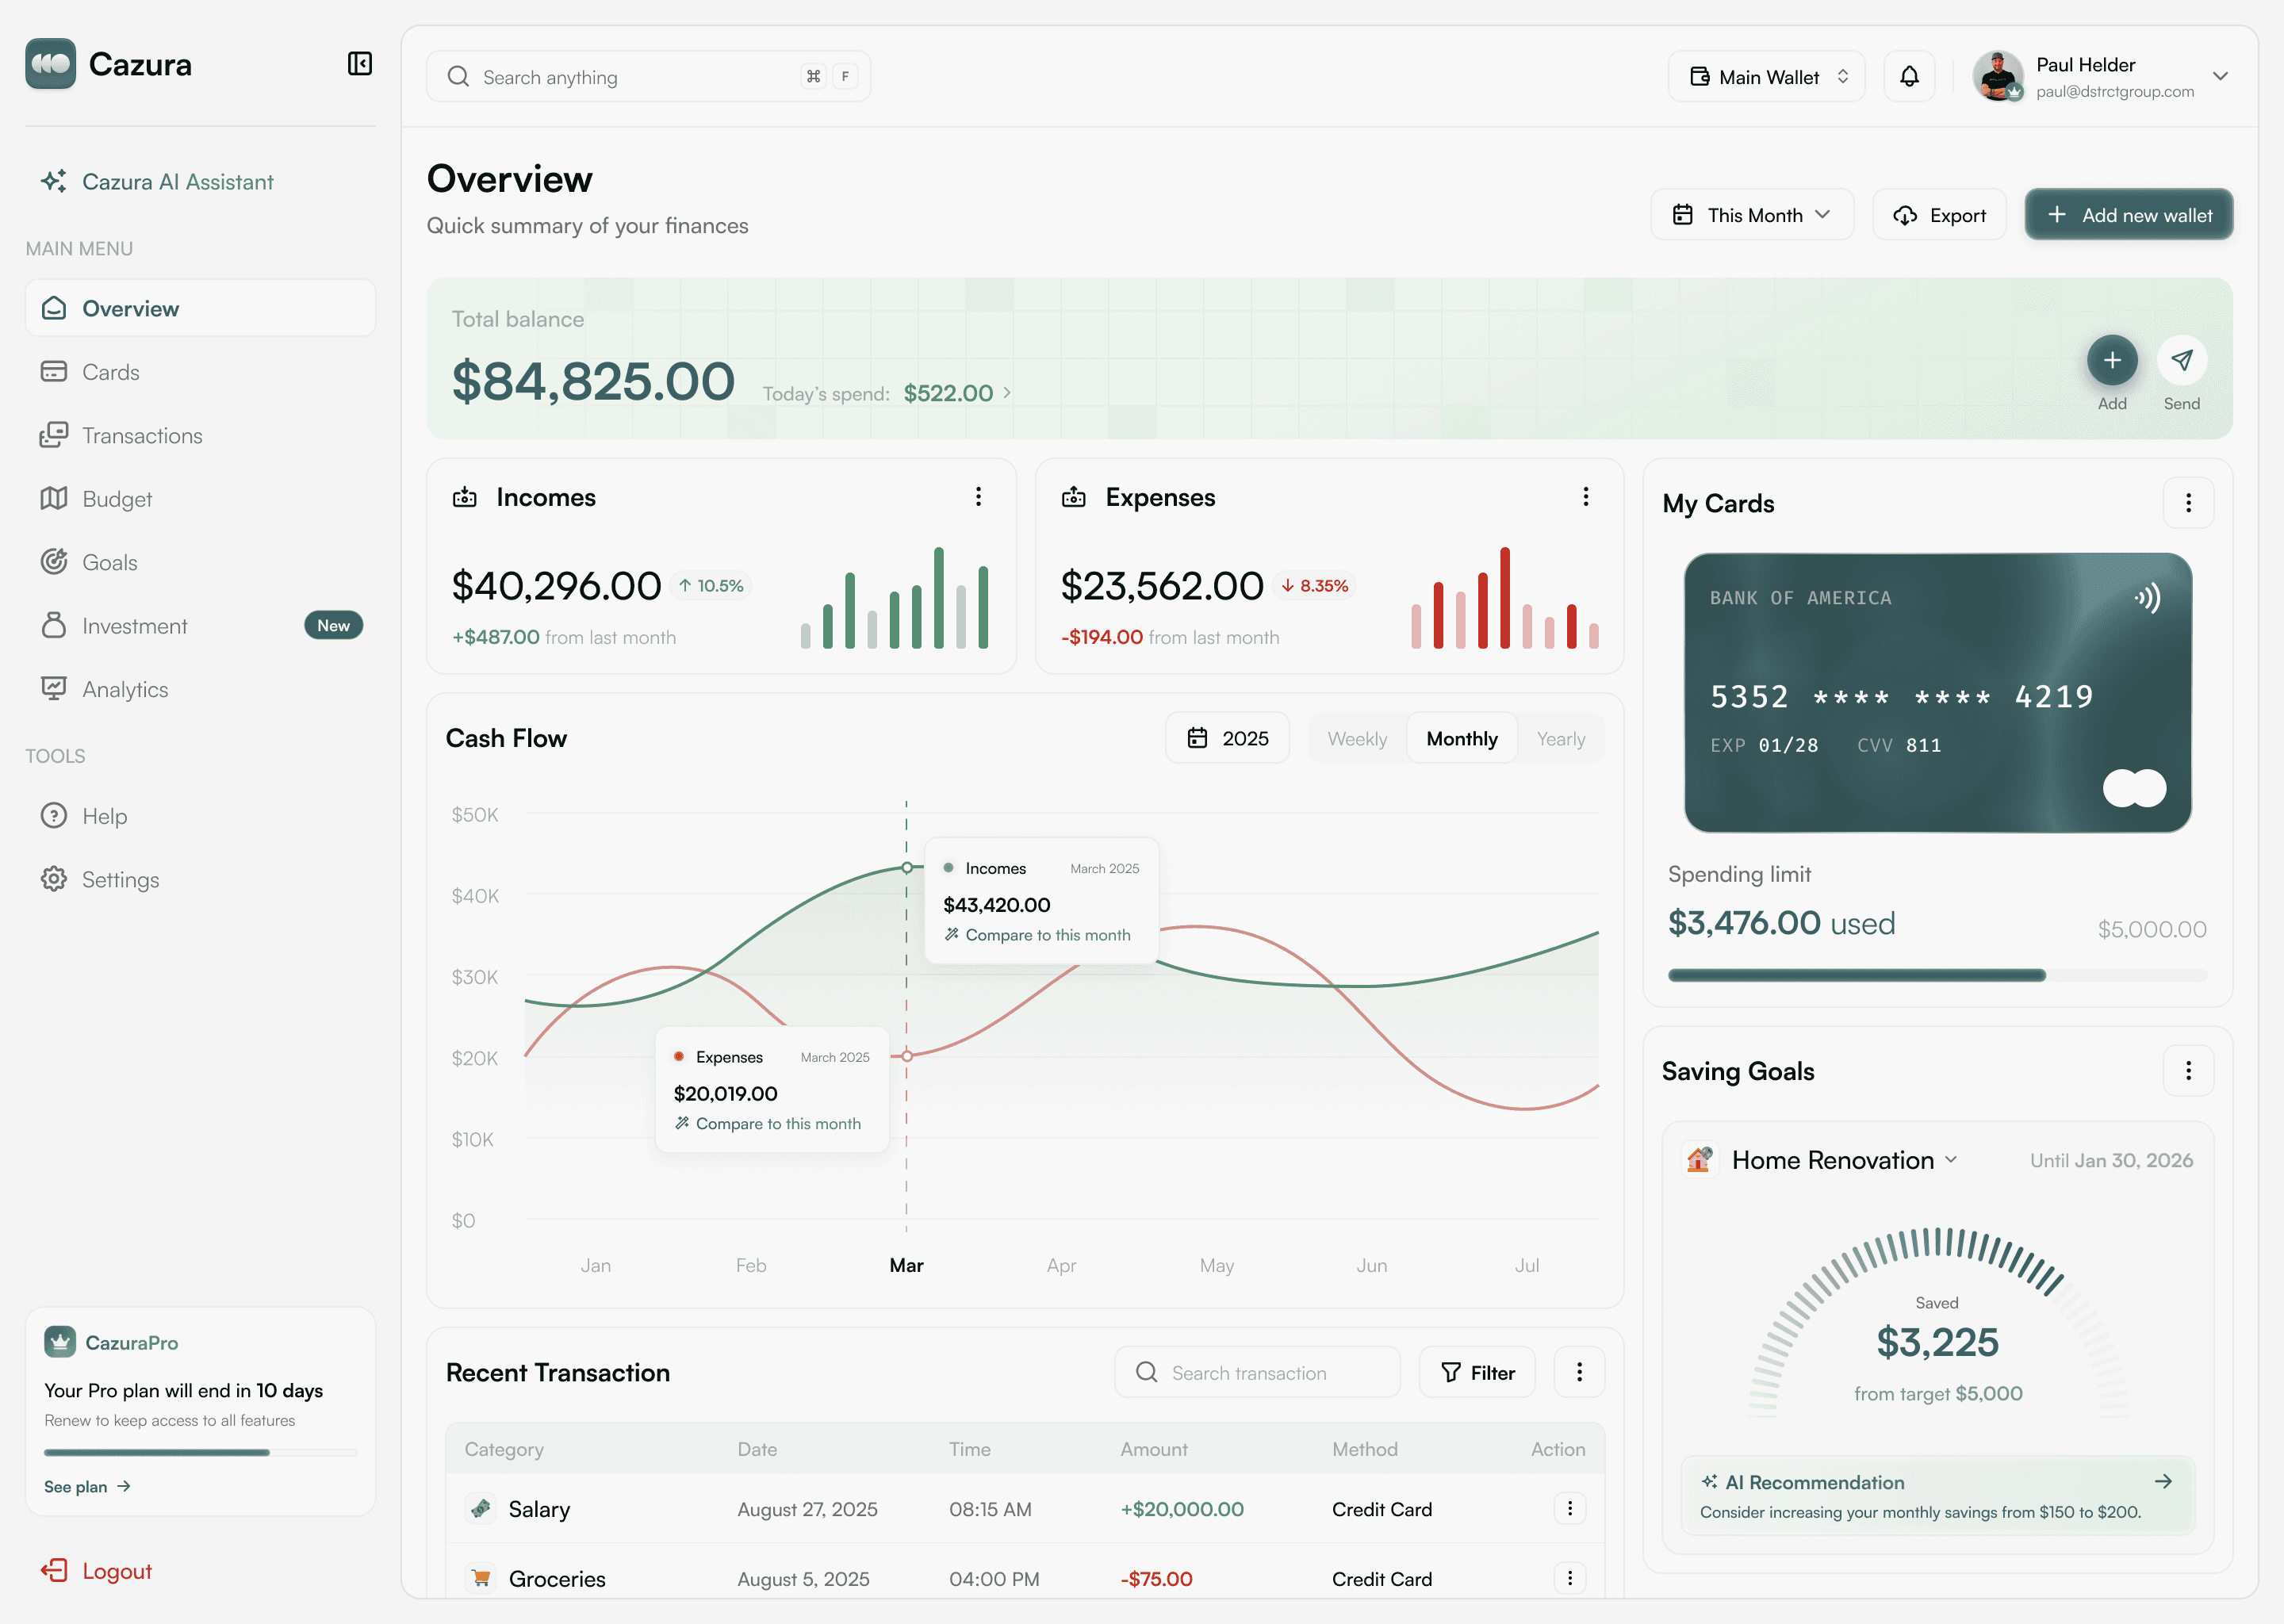
Financial data spread across spreadsheets and bank portals. This platform brings everything together. Transactions, calendar and reports in a clear dashboard.
FinTech / B2B
2026
Transactions
Realtime overview
Calendar
Financial planning
Filters
Advanced search
Export
CSV and PDF
Finances in spreadsheets
The financial team worked with Excel files and bank portals. Monthly reports took days. Transactions had to be manually categorized. There was no central overview of the financial position.
Financial insight in one click
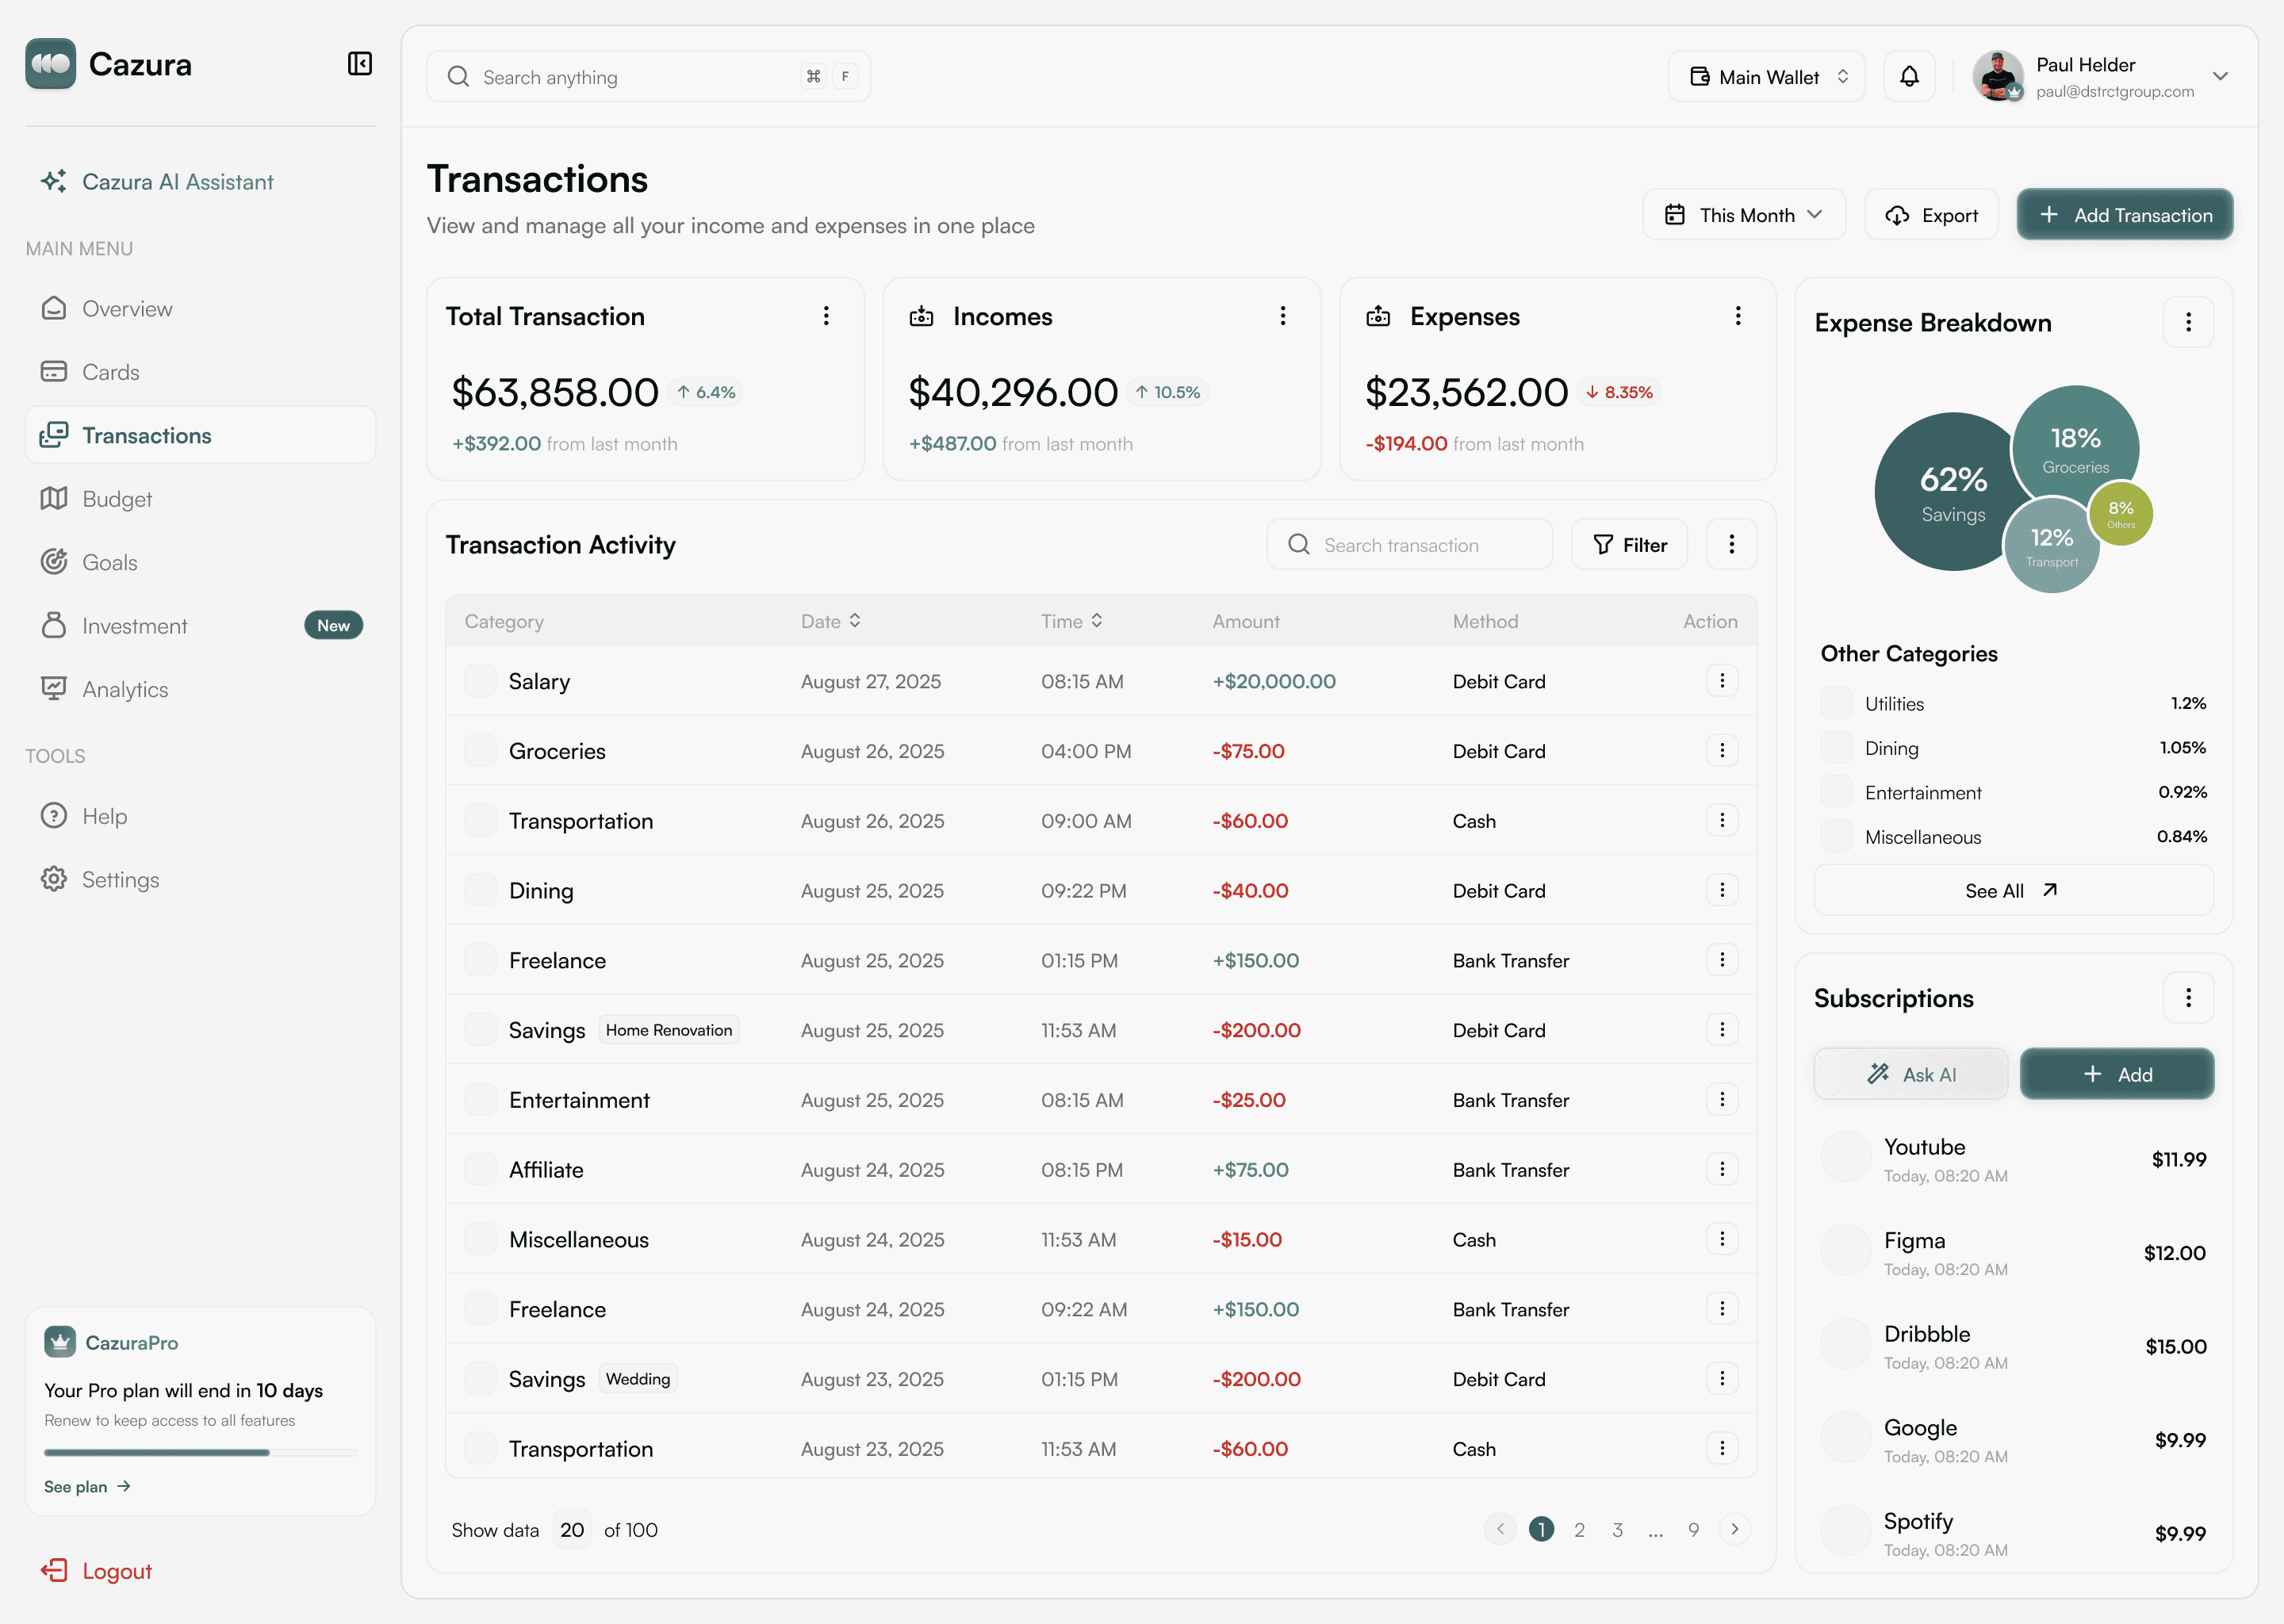
A web application that centralizes all financial data. Transactions are automatically categorized. The calendar shows payment deadlines. Filters make it possible to find the right data within seconds. Reports are generated with one click.
Financial management tailored
Financial Dashboard
Revenue, costs and profit on one screen. Charts show trends per month, quarter or year. The dashboard adapts based on the selected period.
Financial Calendar
Payments, invoice deadlines and planned expenses on a timeline. Colors indicate the status. Click on a day for the full overview.
Advanced Filters
Filter transactions by date, category, amount or status. Combine filters for quick insight. Save frequently used filter sets as shortcuts.
Export and Reporting
Export data to CSV for the accountant or generate a PDF report for management. Automatic monthly reports are configurable.
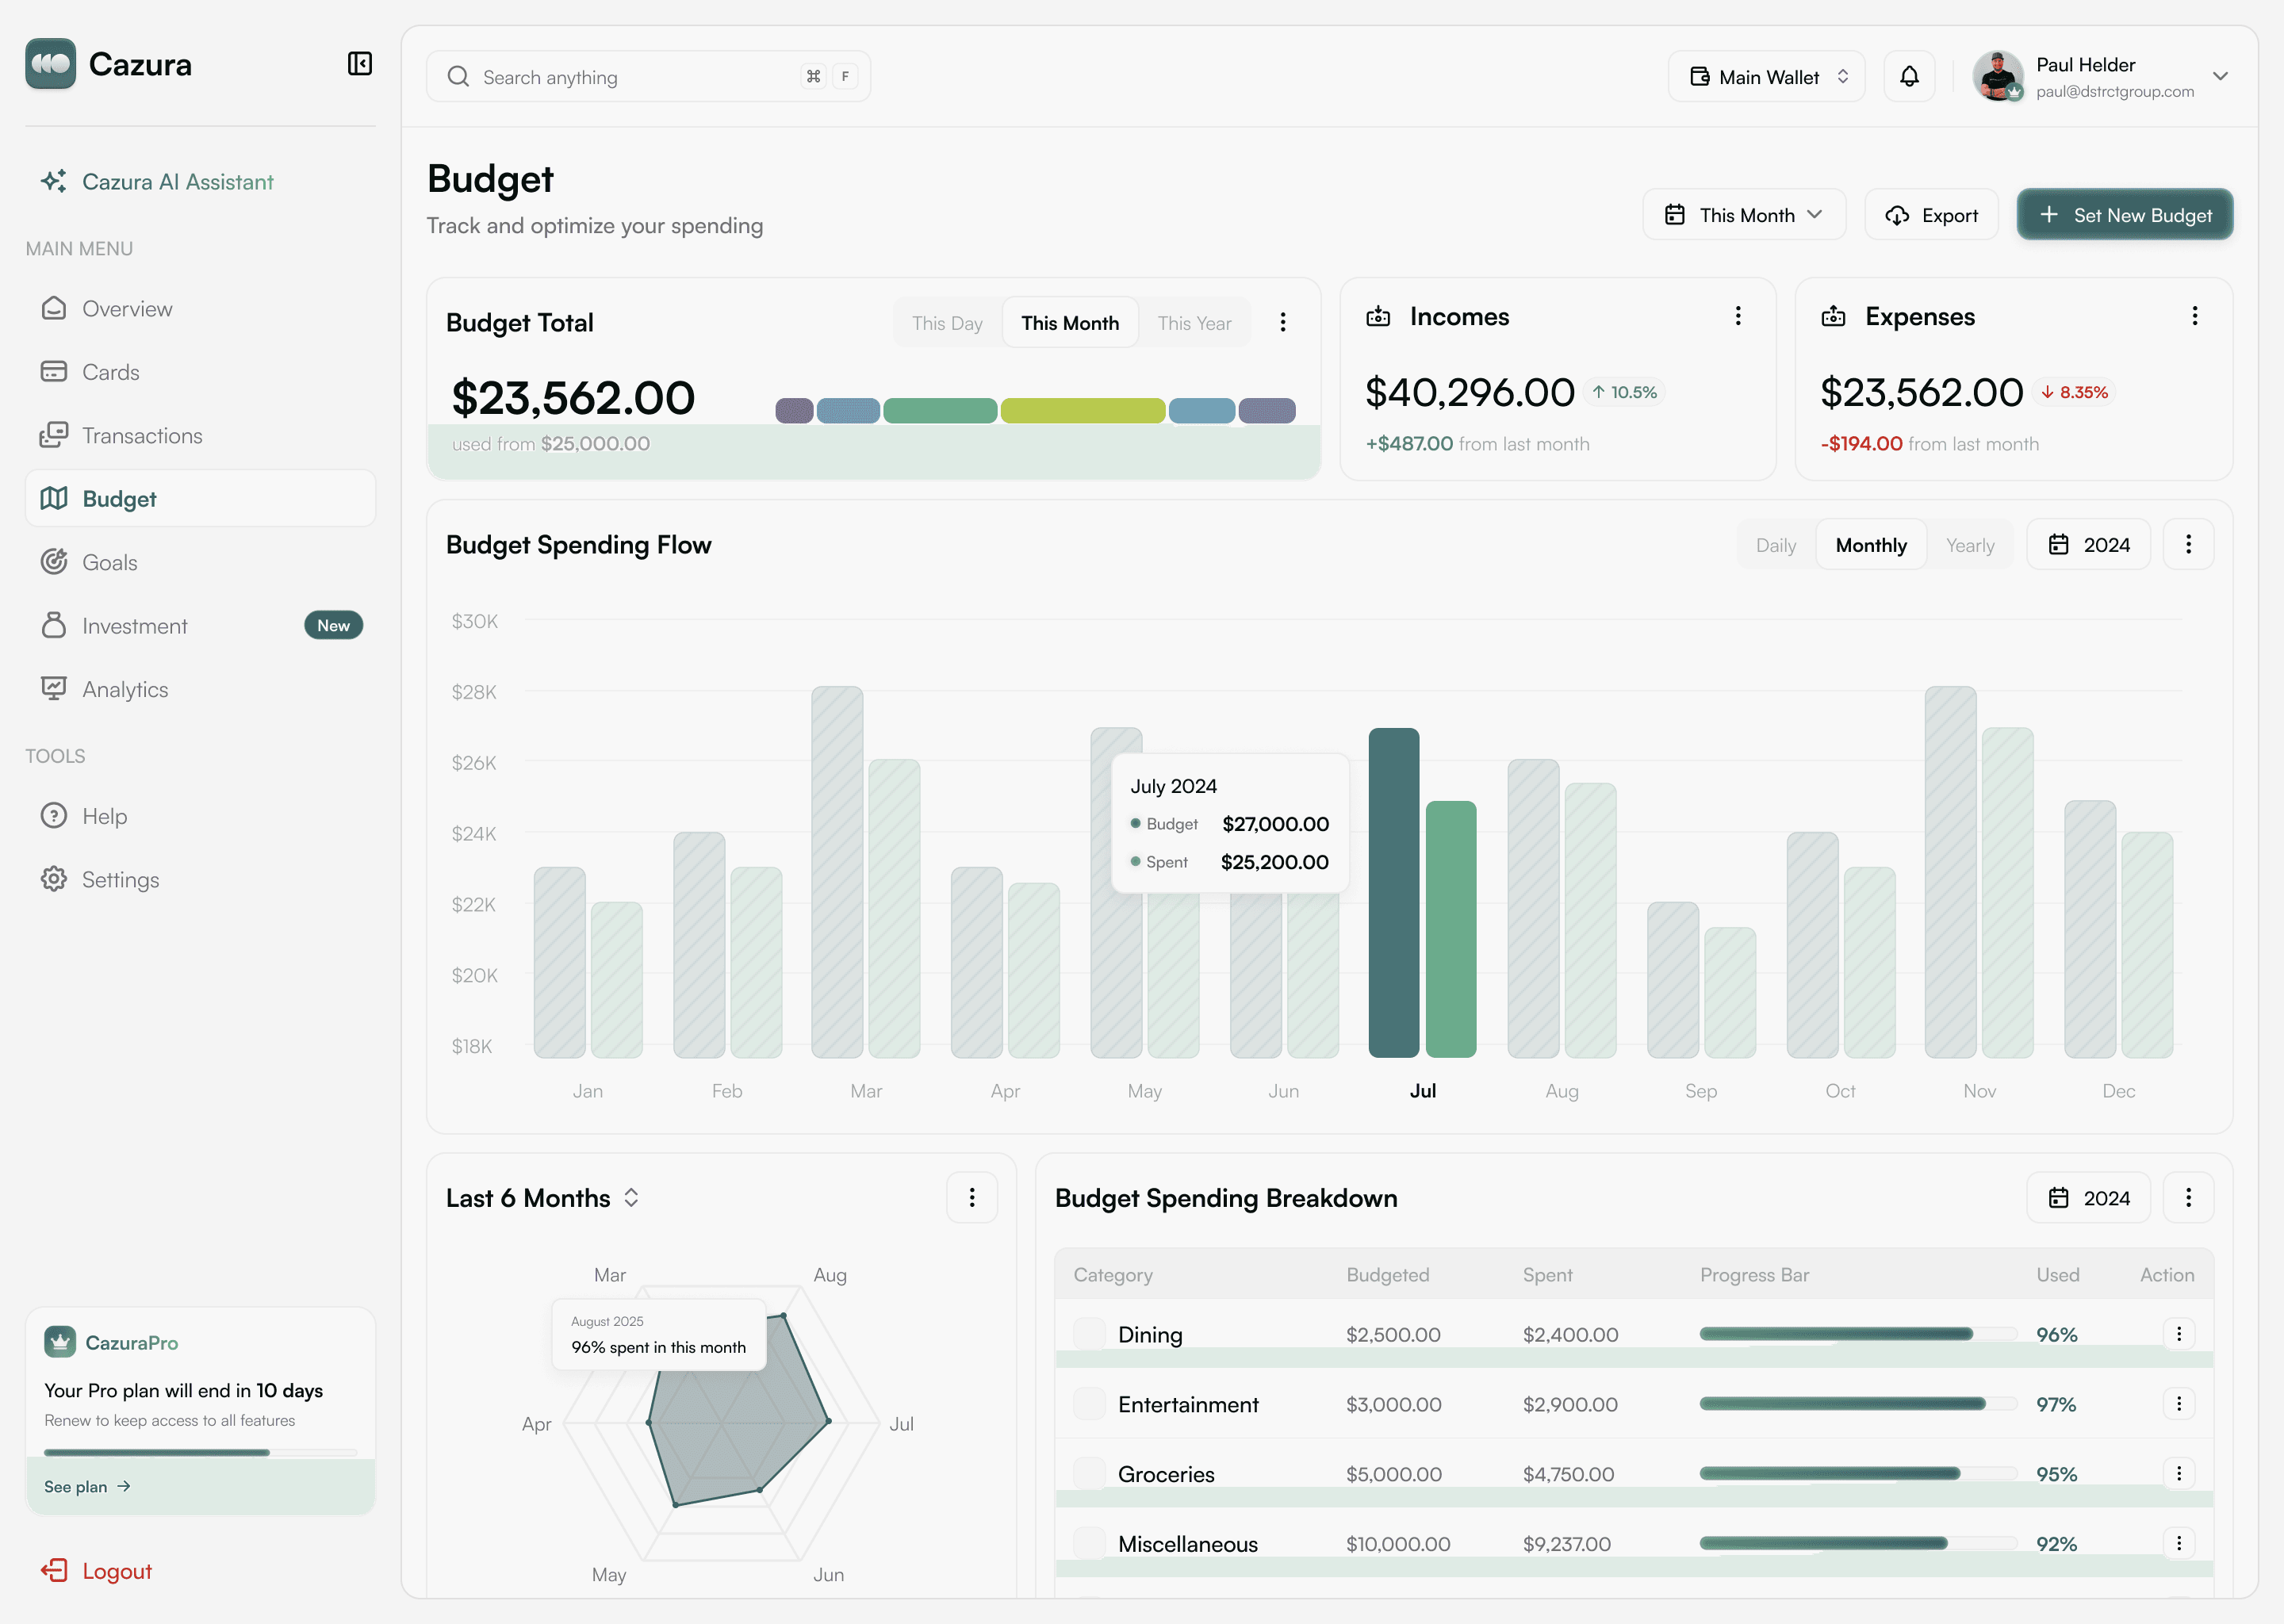
Category Analysis
Distribution of income and expenses per category. Immediately see which cost items are largest and where savings are possible.
Secure Access
Role-based access determines who sees which data. Financial managers see everything, team leads only their department. Every action is logged.
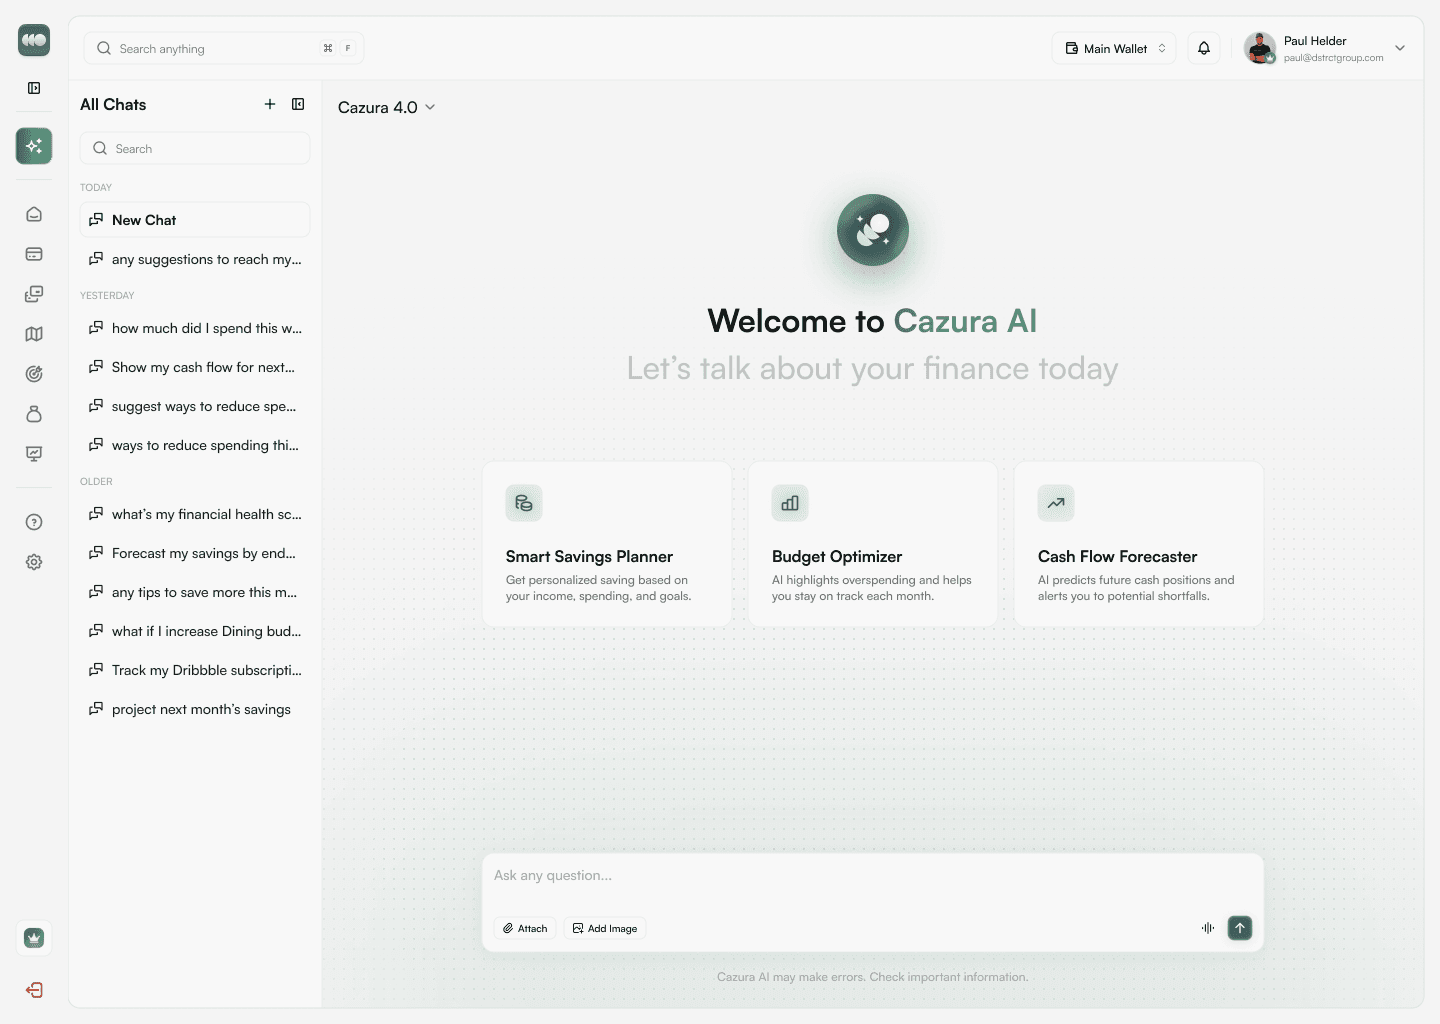
The platform in action
Faster insight, better decisions
Less reporting time
Monthly reports that took days are now ready with one click.
Financial overview
No more waiting for monthly figures. The position is always current.
Audit-ready
Every transaction is categorized and traceable. Ready for any audit.
Data stack for financial precision

Have a financial dashboard built?
From spreadsheets to a platform that grows with you. We build financial tools tailored to your organization.
Start the conversation